Correlation curves. — Figure 34 is arranged to show certain relations of special interest in this connection. At the top was found the mean pine and sequoia curves for 490 years averaged on an 11.4-year period. Below these the mean 11.4-year period for the last 60-year interval is given for each tree. This is required for proper comparison with the short interval of climatic records. Next the rainfall and temperature observed on the southern California coast are plotted, and last of all the inverted sunspot curve for a corresponding period. There appears to be a marked relationship between these curves. Even the subordinate crest, which sometimes shows in the change from maximum to mini-

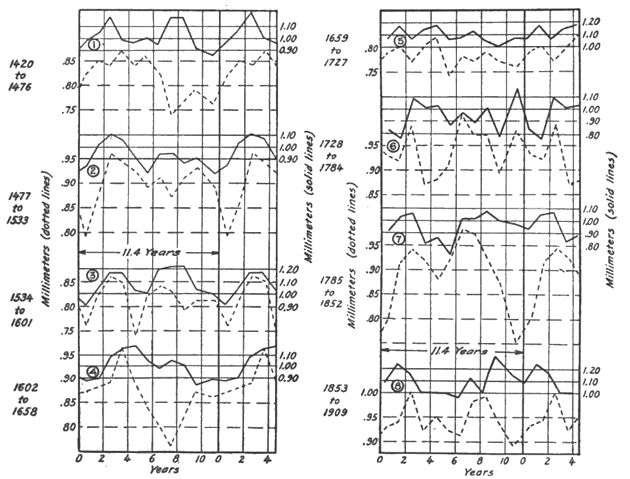
Fig. 33.—Changes in the 11-year period in 500 years. Solid line, Arizona pine; dotted line, sequoia.
mum of sunspots, matches the suppressed second crest of temperature and the full second crest of rainfall and tree-growth. This would seem impossible in the absence of a physical relation between them.
Double and triple cycles. — The first tabulation of the Arizona pines covered a period of only 200 years and included 25 trees. There were a few errors of identification in some of these trees, sufficient to flatten
1 The correction for the ring 1580 was made too late for insertion in this figure. The two dotted curves between 1420 and 1533, therefore, should be moved one year to the left, while the third dotted curve between 1534 and 1601 becomes slightly modified. A slight change in the first Arizona curve is required by a correction at 1463 A. D.

