This page has been validated.
484
THE POPULAR SCIENCE MONTHLY.
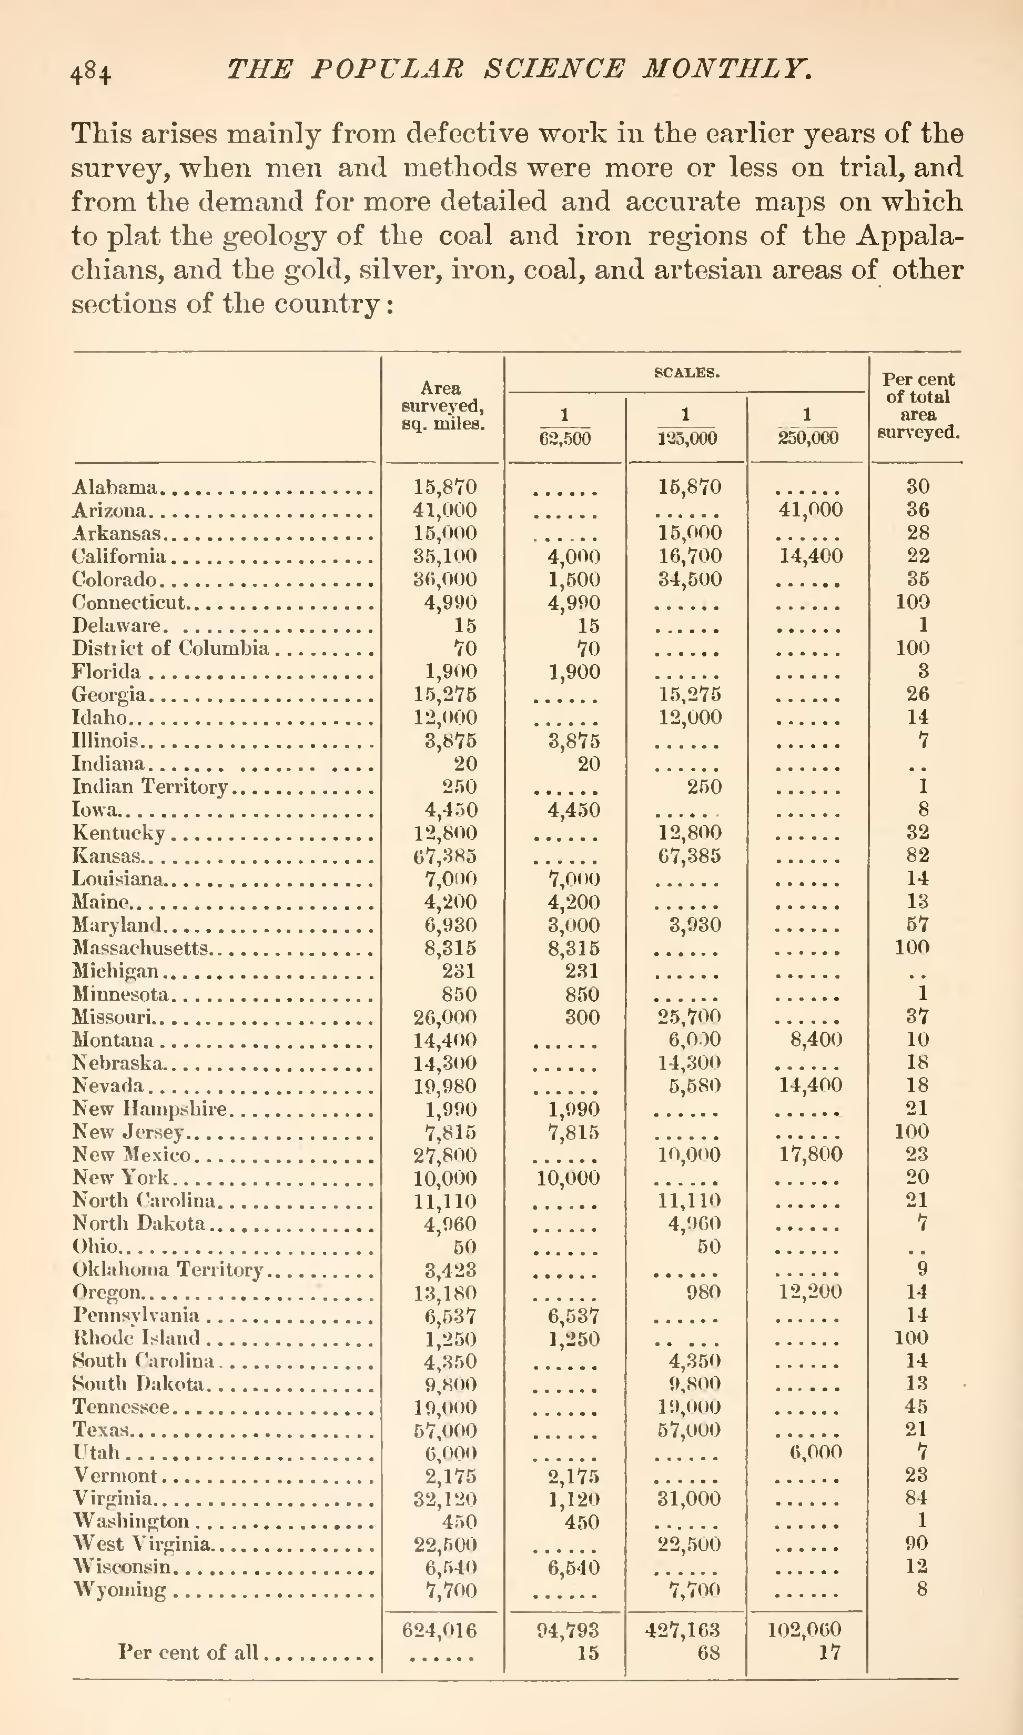
This arises mainly from defective work in the earlier years of the survey, when men and methods were more or less on trial, and from the demand for more detailed and accurate maps on which to plat the geology of the coal and iron regions of the Appalachians, and the gold, silver, iron, coal, and artesian areas of other sections of the country:
| Area surveyed, sq. miles. |
scales. | Per cent of total area surveyed. | |||
| 1/62,500 | 1/125,000 | 1/250,000 | |||
| Alabama | 15,870 | . . . . . . | 15,000 | . . . . . . | 30 |
| Arizona | 41,000 | . . . . . . | . . . . . . | 41,000 | 36 |
| Arkansas | 15,000 | . . . . . . | 15,000 | 28 | |
| California | 35,100 | 4,000 | 16,700 | 14,400 | 22 |
| Colorado | 36,000 | 1,500 | 34,500 | . . . . . . | 35 |
| Connecticut | 4,990 | 4,990 | . . . . . . | . . . . . . | 109 |
| Delaware | 15 | 15 | . . . . . . | . . . . . . | 1 |
| District of Columbia | 70 | 70 | . . . . . . | . . . . . . | 100 |
| Florida | 1,900 | 1,900 | . . . . . . | . . . . . . | 3 |
| Georgia | 15,275 | . . . . . . | 15,275 | . . . . . . | 26 |
| Idaho | 12,000 | . . . . . . | 12,000 | . . . . . . | 14 |
| Illinois | 3,875 | 3,875 | . . . . . . | . . . . . . | 7 |
| Indiana | 20 | 20 | . . . . . . | . . . . . . | . . |
| Indian Territory | 250 | . . . . . . | 250 | . . . . . . | 1 |
| Iowa | 4,450 | 4,450 | . . . . . . | . . . . . . | 8 |
| Kentucky | 12,800 | . . . . . . | 12,800 | . . . . . . | 32 |
| Kansas | 67,385 | . . . . . . | 67,385 | . . . . . . | 82 |
| Louisiana | 7,000 | 7,000 | . . . . . . | . . . . . . | 14 |
| Maine | 4,200 | 4,200 | . . . . . . | . . . . . . | 13 |
| Maryland | 6,930 | 3,000 | 3,930 | . . . . . . | 57 |
| Massachusetts | 8,315 | 8,315 | . . . . . . | . . . . . . | 100 |
| Michigan | 231 | 231 | . . . . . . | . . . . . . | . . |
| Minnesota | 850 | 850 | . . . . . . | . . . . . . | 1 |
| Missouri | 26,000 | 300 | 25,700 | . . . . . . | 37 |
| Montana | 14,400 | . . . . . . | 6,000 | 8,400 | 10 |
| Nebraska | 14,300 | . . . . . . | 14,300 | . . . . . . | 18 |
| Nevada | 19,980 | . . . . . . | 5,580 | 14,400 | 18 |
| New Hampshire | 1,990 | 1,990 | . . . . . . | . . . . . . | 21 |
| New Jersey | 7,815 | 7,815 | . . . . . . | . . . . . . | 100 |
| New Mexico | 27,800 | . . . . . . | 10,000 | 17,800 | 23 |
| New York | 10,000 | 10,000 | . . . . . . | . . . . . . | 20 |
| North Carolina | 11,110 | . . . . . . | 11,110 | . . . . . . | 21 |
| North Dakota | 4,960 | . . . . . . | 4,960 | . . . . . . | 7 |
| Ohio | 50 | . . . . . . | 50 | . . . . . . | . . |
| Oklahoma Territory | 3,423 | . . . . . . | . . . . . . | . . . . . . | 9 |
| Oregon | 13,180 | . . . . . . | 980 | 12,200 | 14 |
| Pennsylvania | 6,537 | 6,537 | . . . . . . | . . . . . . | 14 |
| Rhode Island | 1,250 | 1,250 | . . . . . . | . . . . . . | 100 |
| South Dakota | 9,800 | . . . . . . | 9,800 | . . . . . . | 13 |
| Tennessee | 19,000 | . . . . . . | 19,000 | . . . . . . | 45 |
| Texas | 57,000 | . . . . . . | 57,000 | . . . . . . | 21 |
| Utah | 6,000 | . . . . . . | . . . . . . | 6,000 | 7 |
| Vermont | 2,175 | 2,175 | . . . . . . | . . . . . . | 23 |
| Virginia | 32,120 | 1,120 | 31,000 | . . . . . . | 84 |
| Washington | 450 | 450 | . . . . . . | . . . . . . | 1 |
| West Virginia | 22,500 | . . . . . . | 22,500 | . . . . . . | 90 |
| Wisconsin | 6,540 | 6,540 | . . . . . . | . . . . . . | 12 |
| Wyoming | 7,700 | . . . . . . | 7,700 | . . . . . . | 8 |
| 624,016 | 94,793 | 427,163 | 102,060 | ||
| Per cent of all | . . . . . . | 15 | 68 | 17 | |