Table IV
The Geographical Areas in which Unusually High Proportions of Distinguished Persons were born
| Geographical Area | Total Distinguished Persons |
Distinguished Persons | |
| Per 100,000 Total Population 1880 |
Per 100,000 Native White Population 1880 | ||
| United States | 10,000 | 19.9 | 27.1 |
| New England | 2,311 | 57.6 | 72.4 |
| Middle Atlantic | 2,974 | 28.4 | 35.9 |
| East North Central | 2,225 | 19.9 | 24.4 |
| West North Central | 542 | 8.6 | 10.9 |
| South Atlantic | 1,091 | 14.2 | 24.3 |
| East South Central | 546 | 9.8 | 15.3 |
| West South Central | 161 | 4.9 | 7.8 |
| Mountain | 28 | 4.3 | 6.0 |
| Pacific | 122 | 10.9 | 16.3 |
| Vermont | 219 | 65.9 | 75.5 |
| Massachusetts | 1,123 | 62.9 | 85.8 |
| New Hampshire | 189 | 54.5 | 63.1 |
| Connecticut | 334 | 53.6 | 69.2 |
| Maine | 319 | 49.2 | 54.3 |
| Rhode Island | 127 | 45.8 | 64.8 |
| New York | 1,778 | 34.9 | 46.6 |
| Pennsylvania | 941 | 21.9 | 26.1 |
| Ohio | 859 | 26.8 | 31.5 |
| Delaware | 41 | 27.8 | 37.0 |
| Maryland | 218 | 23.3 | 33.9 |
| Virginia | 266 | 17.5 | 30.7 |
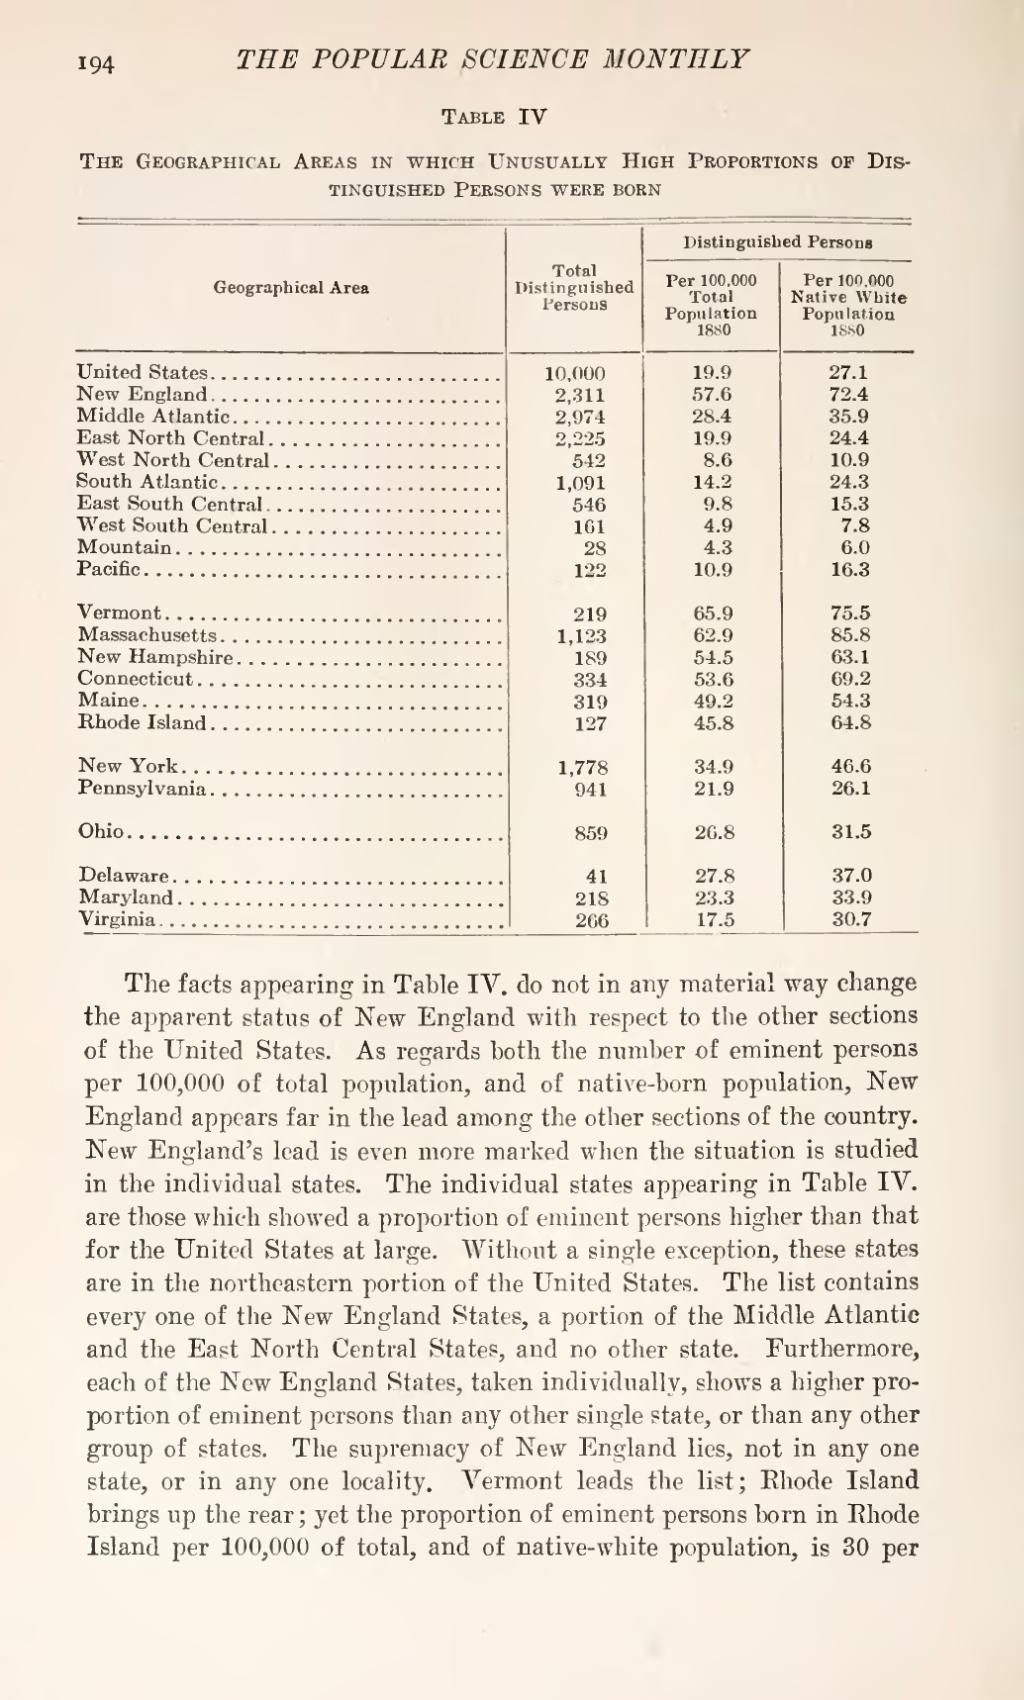
The facts appearing in Table IV. do not in any material way change the apparent status of New England with respect to the other sections of the United States. As regards both the number of eminent persons per 100,000 of total population, and of native-born population, New England appears far in the lead among the other sections of the country. New England's lead is even more marked when the situation is studied in the individual states. The individual states appearing in Table IV. are those which showed a proportion of eminent persons higher than that for the United States at large. Without a single exception, these states are in the northeastern portion of the United States. The list contains every one of the New England States, a portion of the Middle Atlantic and the East North Central States, and no other state. Furthermore, each of the New England States, taken individually, shows a higher proportion of eminent persons than any other single state, or than any other group of states. The supremacy of New England lies, not in any one state, or in any one locality. Vermont leads the list; Rhode Island brings up the rear; yet the proportion of eminent persons born in Rhode Island per 100,000 of total, and of native-white population, is 30 per

