cSOl)
Area and Population. I. Progress and Present Condition.
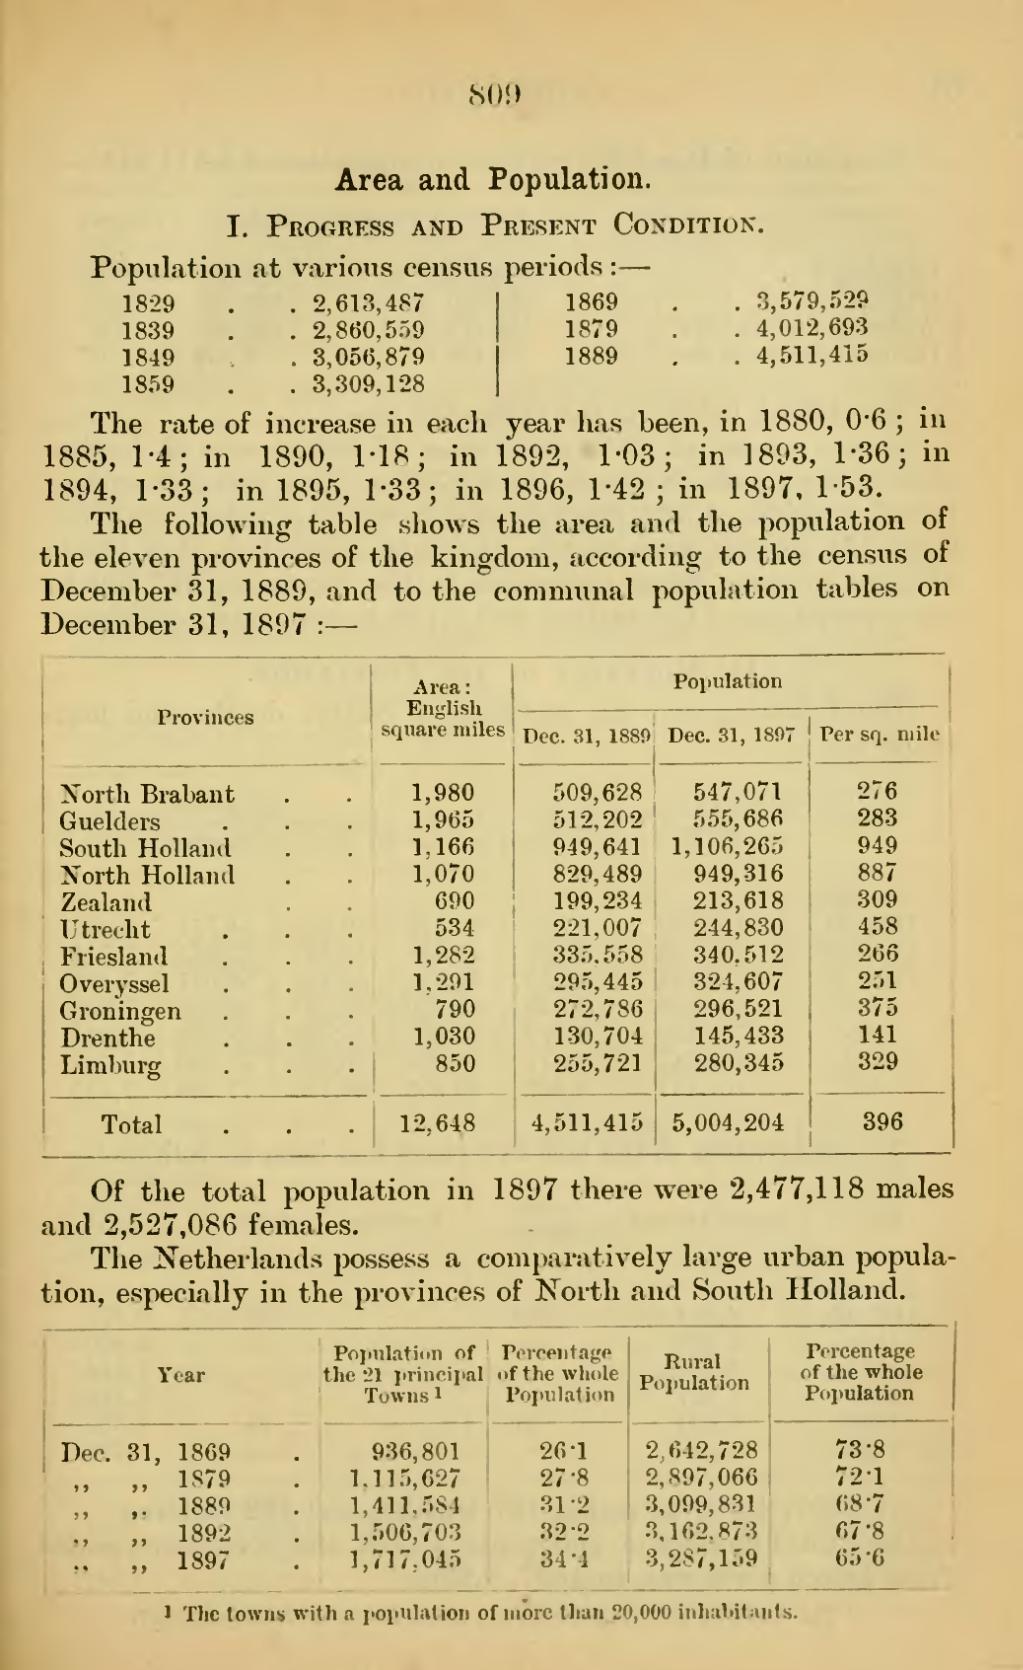
3,579,529 4,012,693 4,511,415
Population at various census periods : —
1829 . . 2,613,487 I 1869
1839 . . 2,860,559 | 1879
1849 . 3,056,879 1889
1859 . . 3,309,128 |
The rate of increase in each year has been, in 1880, 0*6 ; in 1885, 1-4; in 1890, M8 ; in 1892, 1'03; in 1893, 1-36; in 1894, 1-33; in 1895, 1*33; in 1896, 1-42; in 1897, 153.
The following table shows the area and the population of the eleven provinces of the kingdom, according to the census of December 31, 1889, and to the communal population tables on December 31, 1897 :—
Area :
English
Population j
Provinces
square miles
Dec. 31, 1889
Dec. 31, 1897
Per sq. mile
IN'ortli Brabant
1,980
509,628
547,071
276
Guelders
1,965
512,202
555,686
283
South Holland
1,166
949,641
1,106,265
949
North Holland
1,070
829,489
949,316
887
Zealand
690
199,234
213,618
309
Utrecht
534
221,007
244,830
458
Friesland
1,282
335.558
340.512
266
Overvssel
1.291
295,445
324,607
251
Groningen
790
272,786
296,521
375
Drenthe
1,030
130,704
145,433
141 ,
Limburg
850 12,6^8
255,721
280,345
329
Total
4,511,415
5,004,204
396
Of the total population in 1897 there were 2,477,118 males and 2,527,086 females.
The Netherlands possess a comparatively large urban popula- tion, especially in the provinces of North and South Holland.
Year
Popnlatitin of
the 21 principal
Towns 1
936,801 1,115,627 1,411,584 1.506,703 1,717.045
Porcentagc of the whole Population
26-1
27-8 31-2 32 "2 34-4
Rural Population
Percentage of the whole Population
Dec.
31, 1869 ,, 1879 ,. 1889 ,, 1892 ,, 1897
2,642,728 2,897,066 3,099.831 3,162,873 3,287,159
73-8
72-1 ■
68-7 67-8 65-6
1 Tlic towns with a population of more than 20,000 inhabitants.

