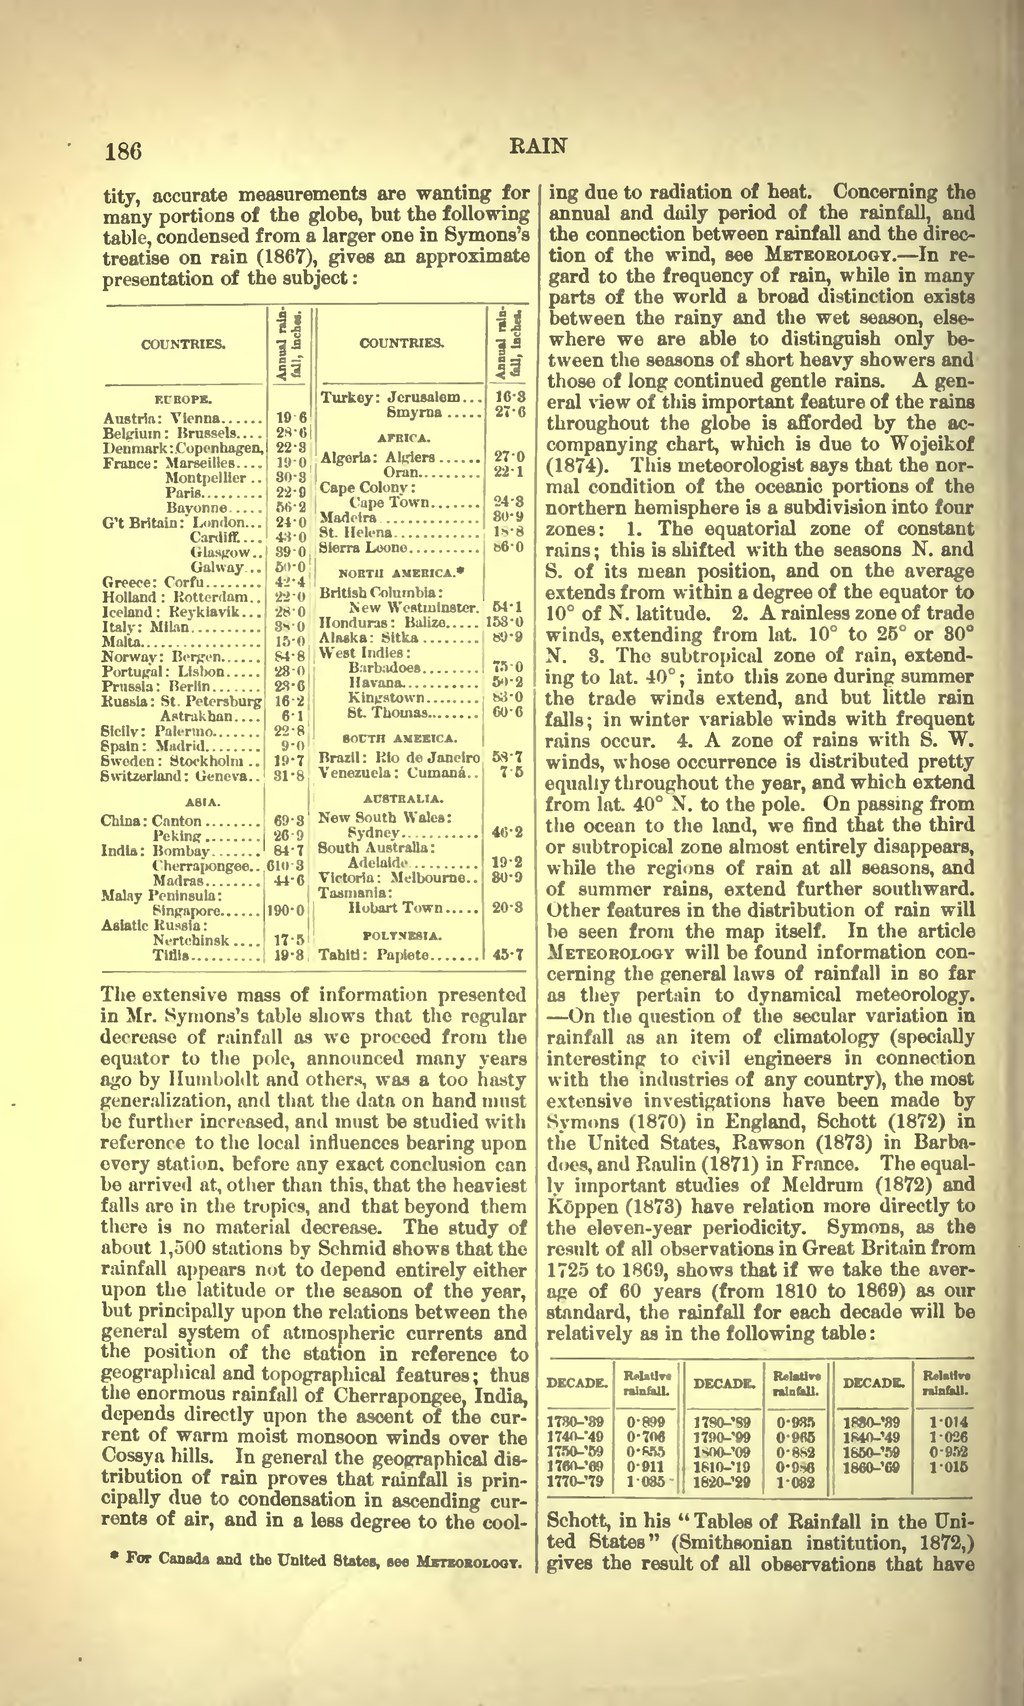
186 RAIN tity, accurate measurements are wanting for many portions of the globe, but the following table, condensed from a larger one in Symons's treatise on rain (1867), gives an approximate presentation of the subject : COUNTRIES. Annual rain- fall, Inchet. COUNTRIES. 11 li is EUROPE. 19 6 28-6 22-8 19-0 80-8 22-9 56-2 24-0 43-0 89-0 50-0 42-4 22-0 28-0 88-0 15-0 s4-s 28-0 28-6 16-2 6-1 22-8 9-0 19-7 81-8 69-8 26-9 84-7 610-8 44-6 190-0 17-5 19-8 Turkey : Jerusalem . . . Smyrna AFRICA. Algeria : Algiers 16-8 27-6 27-0 22-1 24-8 80- 9 18-8 86-0 54-1 158-0 89-9 75-0 5)-2 83-0 60-6 53-7 7-5 46-2 19-2 80-9 20-8 45-7 Belgium : Brussels Deri mark : .Cope n hagen, France: Marseilles Montpellier . . Paris. Oran Cape Colony : Cape Town Bayonne G't Britain: London... Cardiff. . . . Glasgow.. Gal way... Greece : Corfu Madeira St. Helena NORTH AMERICA.* British Columbia : New Westminster. Honduras : Balize Alaska: Sitka Holland: Rotterdam.. Iceland : Reykjavik . . . Italy: Milan West Indies : Barbadoes Portugal : Lisbon Havana. Russia : St. Petersburg Astrakhan Slcilv: Palermo. St. Thomas SOUTH AMERICA. Brazil : Rio de Janeiro Venezuela: Cumana.. AUSTRALIA. New South Wales : Sydney Spain : Madrid Sweden : Stockholm . . Switzerland: Geneva.. ASIA. China : Canton Peking India : Bombay South Australia: Adelaide Cherrapongee. . Madras Malay Peninsula: Singapore Asiatic Russia : Nertchinsk .... Tiflis Victoria: Melbourne.. Tasmania: UobartTown POLYNESIA. Tahiti : Papiete The extensive mass of information presented in Mr. Symons's table shows that the regular decrease of rainfall as wo proceed from the equator to the pole, announced many years ago by Humboklt and others, was a too hasty generalization, and that the data on hand must bo further increased, and must be studied with reference to the local influences bearing upon every station, before any exact conclusion can be arrived at, other than this, that the heaviest falls are in the tropics, and that beyond them there is no material decrease. The study of about 1,500 stations by Schmid shows that the rainfall appears not to depend entirely either upon the latitude or the season of the year, but principally upon the relations between the general system of atmospheric currents and the position of the station in reference to geographical and topographical features ; thus the enormous rainfall of Cherrapongee, India, depends directly upon the ascent of the cur- rent of warm moist monsoon winds over the Cossya hills. In general the geographical dis- tribution of rain proves that rainfall is prin- cipally due to condensation in ascending cur- rents of air, and in a less degree to the cool-
- For Canada and the United States, see METEOROLOGY.
ing due to radiation of heat. Concerning the annual and daily period of the rainfall, and the connection between rainfall and the direc- tion of the wind, see METEOROLOGY. In re- gard to the frequency of rain, while in many parts of the world a broad distinction exists between the rainy and the wet season, else- where we are able to distinguish only be- tween the seasons of short heavy showers and those of long continued gentle rains. A gen- eral view of this important feature of the rains throughout the globe is afforded by the ac- companying chart, which is due to Wojeikof (1874). This meteorologist says that the nor- mal condition of the oceanic portions of the northern hemisphere is a subdivision into four zones: 1. The equatorial zone of constant rains ; this is shifted with the seasons N. and S. of its mean position, and on the average extends from within a degree of the equator to 10 of N. latitude. 2. A rainless zone of trade winds, extending from lat. 10 to 25 or 30 N. 8. The subtropical zone of rain, extend- ing to lat. 40 ; into this zone during summer the trade winds extend, and but little rain falls; in winter variable winds with frequent rains occur. 4. A zone of rains with S. W. winds, whose occurrence is distributed pretty equally throughout the year, and which extend from lat. 40 N. to the pole. On passing from the ocean to the land, we find that the third or subtropical zone almost entirely disappears, while the regions of rain at all seasons, and of summer rains, extend further southward. Other features in the distribution of rain will be seen from the map itself. In the article METEOROLOGY will be found information con- cerning the general laws of rainfall in so far as they pertain to dynamical meteorology. On the question of the secular variation in rainfall as an item of climatology (specially interesting to civil engineers in connection with the industries of any country), the most extensive investigations have been made by Symons (1870) in England, Schott (1872) in the United States, Rawson (1873) in Barba- does, and Raulin (1871) in France. The equal- ly important studies of Meldrum (1872) and K6ppen (1873) have relation more directly to the eleven-year periodicity. Symons, as the result of all observations in Great Britain from 1725 to 18C9, shows that if we take the aver- ago of 60 years (from 1810 to 1869) as our standard, the rainfall for each decade will be relatively as in the following table : DECADE. Rrlatlrc rainfall. DECADE. RcUtlre rainfall. DECADE. Relative rainfall. 1780-'89 1740--49 1750-'59 176rt-'69 1770-'79 0-899 0-706 0-SS5 0-911 1 1-085- 1780-'89 1790-'9 1SOO-'09 1S10-"19 1820-'2 0-935 0-9B5 n --_' 0-980 I'OU 18MPM 1840-'49 I-.Vl--.Yj 1860-'69 1-014 1-026 0-952 1-015 Schott, in his " Tables of Rainfall in the Uni- ted States" (Smithsonian institution, 1872,) gives the result of all observations that have
