The Employment Situation in February
By Cecilia Rouse, Chair of the Council of Economic Advisers
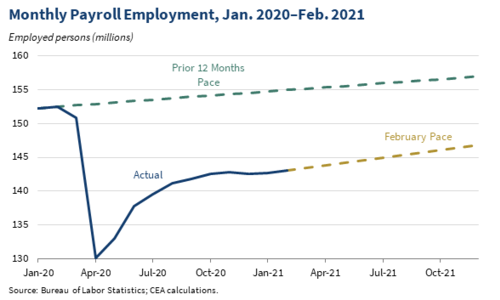
This morning’s jobs report shows an acceleration in job growth in February and an upward revision to January’s job growth. However, the economy remains down 9.5 million jobs from February 2020 and will require more than two years of job growth at February’s pace just to get back to pre-pandemic levels.
The economy added 379,000 jobs in February after adding a revised 166,000 jobs in January. While February’s job growth surprised substantially to the upside, its pace of job growth will not get workers back to work quickly given the magnitude of the employment loss—there are roughly 9.5 million fewer jobs now than in February 2020, before the pandemic took hold in the U.S.
The unemployment rate ticked down to 6.2 percent, from 6.3 percent in January. This remains 2.7 percentage points above the rate in February 2020, before the pandemic sent many workers home and shuttered businesses and schools. Over this same time period, more than 4 million workers have dropped out of the labor force. Accounting for labor force dropouts and misclassification issues related to BLS’s survey questions would result in an unemployment rate around 9.5 percent. This is not to say the headline unemployment rate is wrong, simply that in a pandemic, getting a full view of the economy requires looking at the data in multiple ways.
The unemployment rate also varies substantially across groups, based on both the official unemployment rate and the one adjusted for labor force dropout and misclassification issues. Black and Latino workers have been particularly hard hit, with the adjusted rate for both in double digits.
| Demographic | BLS Official Unemployment Rate |
LFPR and Misclassification- Adjusted UR |
|---|---|---|
| Total | 6.2 | 9.5 |
| White | 5.6 | 8.7 |
| Black | 9.9 | 14.6 |
| Asian | 5.1 | 8.3 |
| Latino | 8.5 | 12.4 |
| Male | 6.3 | 9.2 |
| Female | 6.1 | 9.8 |
Source: Bureau of Labor Statistics. CEA calculations.
Note: Rate of misclassification among employed workers is assumed to be identical across demographic groups. All data are for workers 16+.
While the official unemployment rate for women is just below that for men, once adjusted it is higher for women than it is for men reflecting how many more women have exited the labor force entirely. The labor force participation rate for women 20 years and over is down 2.2 percentage points relative to February 2020, compared to a decline of 2.0 percentage points for men.
The overall male-female difference in labor force participation changes masks wide variation by race. White men and women have declines in labor force participation rates that are relatively similar (2.0 percentage points for white men and 1.9 for white women). On the other hand, the labor force participation rate is down 1.8 percentage points for Black men, but 4.2 percentage points for Black women. For Hispanic men it is 1.8 percentage points lower than February 2020, while for Hispanic women it is down by 4.1 percentage points.
Black women were only 14 percent of the female labor force in February 2020, but have accounted for a disproportionate 26 percent of female labor force dropouts since then. Hispanic women were only 17 percent of the female labor force in February 2020 but have accounted for 27 percent of the female labor force dropouts. (These categories are overlapping and cannot be added together).

The Bureau of Labor Statistics does not provide seasonally adjusted breakdowns for Asian men and women as part of their release. However, not seasonally adjusted, the labor force participation rate in February 2021 for Asian men was down 1.8 percentage points from February 2020 relative to 1.9 percentage points for Asian women. The not seasonally adjusted unemployment rate for Asian women was higher than it was for men.
On the payroll side, employment remains down roughly 9.5 million jobs from February 2020. This is greater than the worst point of job loss at the depths of the Great Recession. At February’s pace of job growth, it would take an additional 25 months to get back to the number of jobs we had before the pandemic took hold.

The overall jobs gap masks very different trends across industries. By far the worst hit industry is leisure and hospitality. Leisure and hospitality added 355,000 jobs in February, and its losses in January were revised down. However, over the last three months the industry has lost an average of 56,000 jobs, reflecting heavy losses in December. This industry alone accounts for around 36 percent of jobs lost during the pandemic. On the other hand, the financial activities sector, where workers can more easily telecommute, has held up relatively well, down only 1 percent from February 2020. State and local government employment continues to suffer, down 1.4 million jobs from February 2020, of which one million are in education.

As the Administration stresses every month, the monthly employment and unemployment figures can be volatile, and payroll employment estimates can be subject to substantial revision. Therefore, it is important not to read too much into any one monthly report, and it is informative to consider each report in the context of other data as they become available.
![]()
This work is in the public domain in the United States because it is a work of the United States federal government (see 17 U.S.C. 105).
![]()
Public domainPublic domainfalsefalse
